
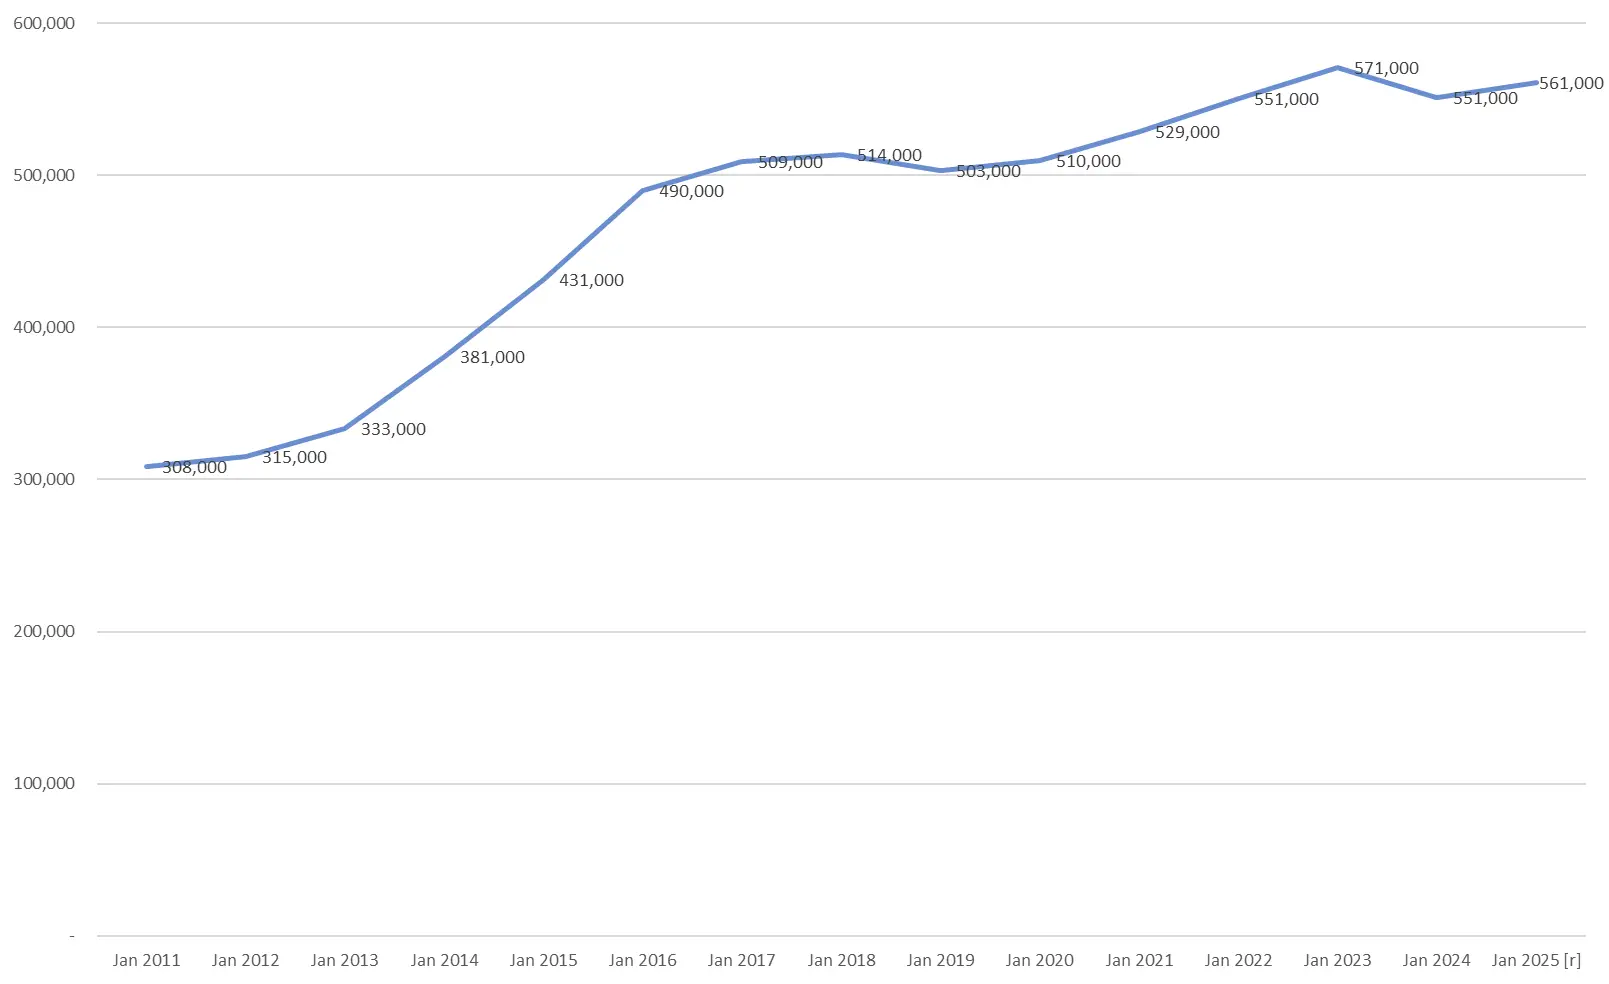
Average sold price increased by 82% for the last 15 years
| Year | Average Price | vs. Previous Year |
|---|---|---|
| 2011 | 308,000 | – |
| 2012 | 315,000 | +2.27% |
| 2013 | 333,000 | +5.71% |
| 2014 | 381,000 | +14.41% |
| 2015 | 431,000 | +13.12% |
| 2016 | 490,000 | +13.70% |
| 2017 | 509,000 | +3.88% |
| 2018 | 514,000 | +0.98% |
| 2019 | 503,000 | −2.14% |
| 2020 | 510,000 | +1.39% |
| 2021 | 529,000 | +3.73% |
| 2022 | 551,000 | +4.16% |
| 2023 | 571,000 | +3.63% |
| 2024 | 551,000 | −3.50% |
| 2025 | 561,000 | +1.81% |
London is a leading centre of politics, economics, and culture, with strong fundamentals underpinning property values.
Actual economic growth (2010-2022)
| Total economic growth | Annual economic growth | |
|---|---|---|
| London | +23.1% | 1.75% |
| Tokyo | +19.1% | 1.47% |
In nominal terms, London has shown growth around 2.5 times that of Tokyo, but even in real terms (inflation-adjusted) it has maintained stronger growth of +1.75% per year. In other words, the London economy has been expanding steadily even after excluding the effects of price increases, demonstrating its strength as an international investment destination.
With a growing population, including immigrants and international students, rental demand remains resilient, keeping vacancy risks relatively low.
Population in London
| Year | Population |
|---|---|
| 2001 | 7,172,036 |
| 2002 | 7,200,000 |
| 2003 | 7,270,000 |
| 2004 | 7,330,000 |
| 2005 | 7,390,000 |
| 2006 | 7,456,100 |
| 2007 | 7,512,400 |
| 2008 | 7,580,000 |
| 2009 | 7,753,600 |
| 2010 | 7,820,000 |
| 2011 | 8,173,900 |
| 2012 | 8,240,000 |
| 2013 | 8,416,535 |
| 2014 | 8,546,761 |
| 2015 | 8,650,000 |
| 2016 | 8,798,957 |
| 2017 | 8,850,000 |
| 2018 | 8,900,000 |
| 2019 | 8,950,000 |
| 2020 | 8,980,000 |
| 2021 | 8,799,800 |
| 2022 | 8,900,000 |
| 2023 | 8,900,000 |
Source: ONS
Net Migration to London from abroad
| Year | Net Migration | Reference |
|---|---|---|
| 2001–2006 | 70,000 – 100,000 | Moderate increase trend by expanding EU and economic growth |
| 2007–2010 | 100,000 – 120,000 | Continuous stable migration even time of financial crisis |
| 2011–2015 | 120,000 – 140,000 | Students & skilled workers increased |
| 2016–2019 | 140,000 – 160,000 | Increase of migrants before or after Brexit |
| 2020 | Decrease by COVID | Decreased due to COVID |
| 2021 | 120,000 | Back to increase trend after COVID |
| 2022 | 140,000 | Students & Skilled workers from US & EU increased |
| 2023 | 154,000 data.london.gov.uk Record in history |
Sources: Greater London Authority (GLA), Recent migration trends in the UK and London, 2024Office for National Statistics (ONS), International and internal migration estimates, annual releasesLondon Datastore: data.london.gov.ukNote: Some 2020–2023 values are based on GLA modelled estimates due to COVID-19 disruption in official data collection.
Between 2001 and 2023, the cumulative net immigration is estimated at over 2 million, exceeding total population growth of around 1.7 million over the same period.The latest figure for 2023 shows just under 150,000 per year — a scale comparable to periods of rapid growth. This trend is driven by international students (particularly from China and India), expatriates, and non-EU migration linked to Brexit, as well as the situations in Hong Kong and Ukraine.
In the UK, rents tend to rise during periods of inflation, helping to preserve the real value of assets.
Holding assets in sterling as well as yen allows investors to diversify currency risk and achieve broader international portfolio diversification.
With the weakening trend of the yen, values expressed in yen terms have risen by 170% due to exchange rate effects.
Average £ to Yen rate for the past 15 years is approx. 165yen
| Year | (£) | Ave. Price | Price in Yen |
|---|---|---|---|
| 2011 | 308,000 | 128 | 39,424 |
| 2012 | 315,000 | 126 | 39,690 |
| 2013 | 333,000 | 151 | 50,283 |
| 2014 | 381,000 | 174 | 66,294 |
| 2015 | 431,000 | 185 | 79,735 |
| 2016 | 490,000 | 150 | 73,500 |
| 2017 | 509,000 | 145 | 73,805 |
| 2018 | 514,000 | 147 | 75,558 |
| 2019 | 503,000 | 139 | 69,917 |
| 2020 | 510,000 | 138 | 70,380 |
| 2021 | 529,000 | 151 | 79,879 |
| 2022 | 551,000 | 162 | 89,262 |
| 2023 | 571,000 | 175 | 99,925 |
| 2024 | 551,000 | 180 | 99,180 |
| 2025 | 561,000 | 190 | 106,590 |
London properties attract strong demand from overseas investors, offering liquidity and making future resale easier.
Compared with property investment in Japan, London offers competitive overall returns, including capital gains, typically around 4–5%.